Linux extended Berkeley Packet Filters
Be kind to the WiFi!
Be kind with others
Thank you!
Slides: https://workshop.bpf.sh/
Pre-requirements
A machine with Linux Kernel 4.18+ (or the provided Vagrant machine)
Be comfortable with the UNIX command line
navigating directories
editing files
a little bit of bash-fu (environment variables, loops)
Tell me and I forget.
Teach me and I remember.
Involve me and I learn.
Misattributed to Benjamin Franklin
(Probably inspired by Chinese Confucian philosopher Xunzi)
Terminals
Once in a while, the instructions will say:
“Open a new terminal.”
There are multiple ways to do this:
create a new window or tab on your machine, and SSH into the VM;
use screen or tmux on the VM and open a new window from there;
Or if you are executing in a local Linux machine just open a new terminal in there;
You are welcome to use the method that you feel the most comfortable with.
Tmux cheatsheet
Tmux is a terminal multiplexer like screen.
You don’t have to use it or even know about it to follow along.
But some of us like to use it to switch between terminals.
It comes preinstalled in the Vagrant machine we provided
- Ctrl-b c → creates a new window
- Ctrl-b n → go to next window
- Ctrl-b p → go to previous window
- Ctrl-b “ → split window top/bottom
- Ctrl-b % → split window left/right
- Ctrl-b Alt-1 → rearrange windows in columns
- Ctrl-b Alt-2 → rearrange windows in rows
- Ctrl-b arrows → navigate to other windows
- Ctrl-b d → detach session
- tmux attach → reattach to session
Vagrant
- If you don’t know what Vagrant is, don’t worry.
- It’s just a tool to create Virtual machines that we use to create a common VM with all the eBPF tools for everyone!
- This workshop comes with a reference environment expressed in a
Vagrantfile. - You don’t have to use this one, but be prepared to install stuff! OS X
brew cask install virtualboxbrew cask install vagrantWindows
Download Vagrant and Virtualbox
Ubuntu
apt install vagrant virtualboxNon-Vagrant (aka. All the other environments)
Make sure to have:
- git
- an editor of your choice
- gcc
- clang
- go
The other tools we need, bpftrace and bcc will have their own setup
instructions in the respective chapters.
Vagrant
After cloning the workshop repository, enter the environment folder:
git clone https://github.com/bpftools/bpf-workshop.gitcd bpf-workshop/environmentThen there are three major things you can do:
# Start the environmentvagrant up# Stop the environmentvagrant halt# Destroy the environmentvagrant destroy# Obtain a shellvagrant sshHands-on sections
The whole workshop is hands-on
We are going to write some eBPF programs
All hands-on sections are clearly identified, like the gray rectangle below
- This is the stuff you’re supposed to do!
Introduction
- The BSD Packet Filter: A New Architecture for User-level Packet Capture
- Virtual Machine to work efficiently with register based CPUs
- Packet filtering without copying data
The extended BPF implementation (eBPF)
- Introduced in 2014 by Alexei Starovoitov
- Increased register size from 2 32-bit registers to 10 64-bit registers
- Initially designed to optimize network filters
The BPF in Kernel Virtual Machine
The BPF in-kernel Virtual Machine
- Implements a general purpose low level RISC instructions
- Runs the instructions in response to events triggered by the kernel
- Implements a verifier, so that your programs can’t break the kernel
- Has different interfaces for different types of programs
- Widely supported in the kernel
- Has an upstream LLVM backend, you can compile eBPF code with clang
The BPF in-kernel Virtual Machine

BPF … eBPF … 🤔
- BPF is the classic implementation, suitable only for basic filtering, BPF is also referred as cBPF;
- The eBPF instruction set is wider than the BPF instruction set;
- BPF does not support maps, eBPF does;
- eBPF has general purpose registers and a stack, BPF only an accumulator and a scratch memory store;
Maps
- BPF Maps data stores that live in the kernel;
- Can be accessed by any BPF program that knows about them;
- Programs that run in user-space can also access these maps by using file descriptors;
- You can store any kind of data in a map, as long as you specify the data size correctly before hand;
- The kernel treats keys and values as binary blobs and it doesn’t care about what you keep in a map;
- This is what we use to let userspace programs to extract or feed information into BPF programs running in the kernel!
Many different types of maps
- Hash table: BPF_MAP_TYPE_HASH
- Array: BPF_MAP_TYPE_ARRAY
- Program array maps: BPF_MAP_TYPE_PROG_ARRAY, this one is magic, allows you to store references to bpf programs so that you can do jumps between bpf programs;
- Perf events array maps: BPF_MAP_TYPE_PERF_EVENT_ARRAY
- Per-CPU hash maps: BPF_MAP_TYPE_PERCPU_HASH
- Per-CPU array maps: BPF_MAP_TYPE_PERCPU_ARRAY
- Stack trace maps: BPF_MAP_TYPE_STACK_TRACE
- Cgroup array maps: BPF_MAP_TYPE_CGROUP_ARRAY
- Hash and per cpu has with LRU cache: BPF_MAP_TYPE_LRU_PERCPU_HASH, BPF_MAP_TYPE_LRU_HASH
- Longest Prefix Match(LPM) Trie: BPF_MAP_TYPE_LPM_TRIE
- Array of maps, and hash of maps, maps:
BPF_MAP_TYPE_ARRAY_OF_MAPSandBPF_MAP_TYPE_HASH_OF_MAPS - And many more! Find all of them
man 2 bpf
Maps operations
- Lookup a single element value,
bpf_map_lookup_elem - Remove an element,
bpf_map_delete_element - Iterating over elements
- Updating an element,
bpf_map_update_elem - Get the next key in the map,
bpf_map_get_next_key - Search, get the value and delete in a single atomic operation,
bpf_map_lookup_and_delete_element - Concurrent access is regulated using a mechanism called
bpf_spin_lockthat is essentially a semaphore;
BPF programs
- Code that’s triggered based on events in the kernel
- Context arguments that depend on the event triggered
- Must always terminate
- Cannot include outbounded control loops
- Limited in the number of instructions to execute (changing soon)
- Can trigger other BPF programs
BPF program helpers
- General helpers available to any program, like
bpf_trace_printkandbpf_get_current_pid_tgid - Specialized helper available only to specific types of programs,
bpf_perf_event_output - https://github.com/iovisor/bpf-docs/blob/master/bpf_helpers.rst
BPF program types
- Socket filtering: BPF_PROG_TYPE_SOCKET_FILTER, BPF_PROG_TYPE_SK_SKB, BPF_PROG_TYPE_SK_MSG, BPF_PROG_TYPE_SK_REUSEPORT
- Tracing: BPF_PROG_TYPE_KPROBE, BPF_PROG_TYPE_TRACEPOINT, BPF_PROG_TYPE_RAW_TRACEPOINT
- XDP: BPF_PROG_TYPE_XDP
- Perf events: BPF_PROG_TYPE_PERF_EVENT
- Cgroups: BPF_PROG_TYPE_CGROUP_SKB, BPF_PROG_TYPE_CGROUP_SOCK, BPF_PROG_TYPE_CGROUP_DEVICE, BPF_PROG_TYPE_CGROUP_SOCK_ADDR
- Infrared devices: BPF_PROG_TYPE_LIRC_MODE2
BPF program example
#include BPF program example (part 2)
clang -O2 -target bpf -c hello_world_kern.c -o hello_world_kern.oBPF program example (part 3)
#include The BPF Compiler Collection
- Toolkit to create and manipulate BPF programs
- Connects BPF programs with high level programming languages
- C++, Python, Lua, and Go frontends
- Dynamic load and unload of BPF programs
BCC included tools
- Tracing and monitoring
- Networking
- Introspection
BCC hello world
- In the
bcc/examplesfolder; - With root permissions;
- Execute the
hello_world.pytool;
BCC hello world destilled
source = """int kprobe__sys_clone(void *ctx) { bpf_trace_printk("Hello, World!\n"); return 0;}"""BPF(text = source).trace_print()BCC perf events
- Real time event service between BPF and frontend.
- Active buffer polling
BCC perf events exercise (part 1)
bpf_source = """#include BCC perf events exercise (part 2)
bpf_source += """int on_execve(struct pt_regs *ctx, const char __user *filename, const char __user *const __user *__argv, const char __user *const __user *__envp){ struct data_t data = {}; bpf_get_current_comm(&data.comm, sizeof(data.comm)); events.perf_submit(ctx, &data, sizeof(data)); return 0;}"""BCC perf events exercise (part 3)
from bcc import BPFfrom bcc.utils import printbdef dump_data(cpu, data, size): event = bpf["events"].event(data) printb(b"%-16s" % event.comm)bpf = BPF(text = bpf_source)execve_function = bpf.get_syscall_fnname("execve")bpf.attach_kprobe(event = execve_function, fn_name = "on_execve")bpf["events"].open_perf_buffer(dump_data)while 1: bpf.perf_buffer_poll()BCC Profile
- Sample stack traces to profile CPU data
- Observe where a running application is spending CPU time
BCC Profile exercise
sudo tools/profile -p PIDBCC Profile exercise (Part 2)
- Download the Flamegrapsh scripts:
git clone https://github.com/brendangregg/FlameGraph- Generate a flamegraph for your profiled data:
sudo tools/profile -p PID -f > /tmp/profile.outflamegraph.pl /tmp/profile.out > /tmp/profile-graph.svg \ && firefox /tmp/profile-graph.svgTakeaways
- Convenient interop with other languages
- Write one time only tools, and background processes
bpftrace: BPF observability front-end
On GitHub https://github.com/iovisor/bpftrace
What it is:
- Higher level language to write eBPF programs;
- Built from the ground-up for BPF and Linux;
- Used in production at Netflix, Facebook, etc;
- Custom one-liners;
- Comes with tools;
- It is just for tracing;
What it is NOT:
- A framework to build your loaders;
- You can’t do classic bpf with it (like seccomp programs or socket probe types);
- It does not support traffic control and XDP;
bpftrace: Installation
We will need to do some exercises with bpftrace. If you are not using the Vagrant environment, you might want to install it now!
Ubuntu snap package
sudo snap install --devmode bpftracesudo snap connect bpftrace:system-traceFedora (28 or later)
sudo dnf install bpftraceYou can find further instructions here
bpftrace: Syntax
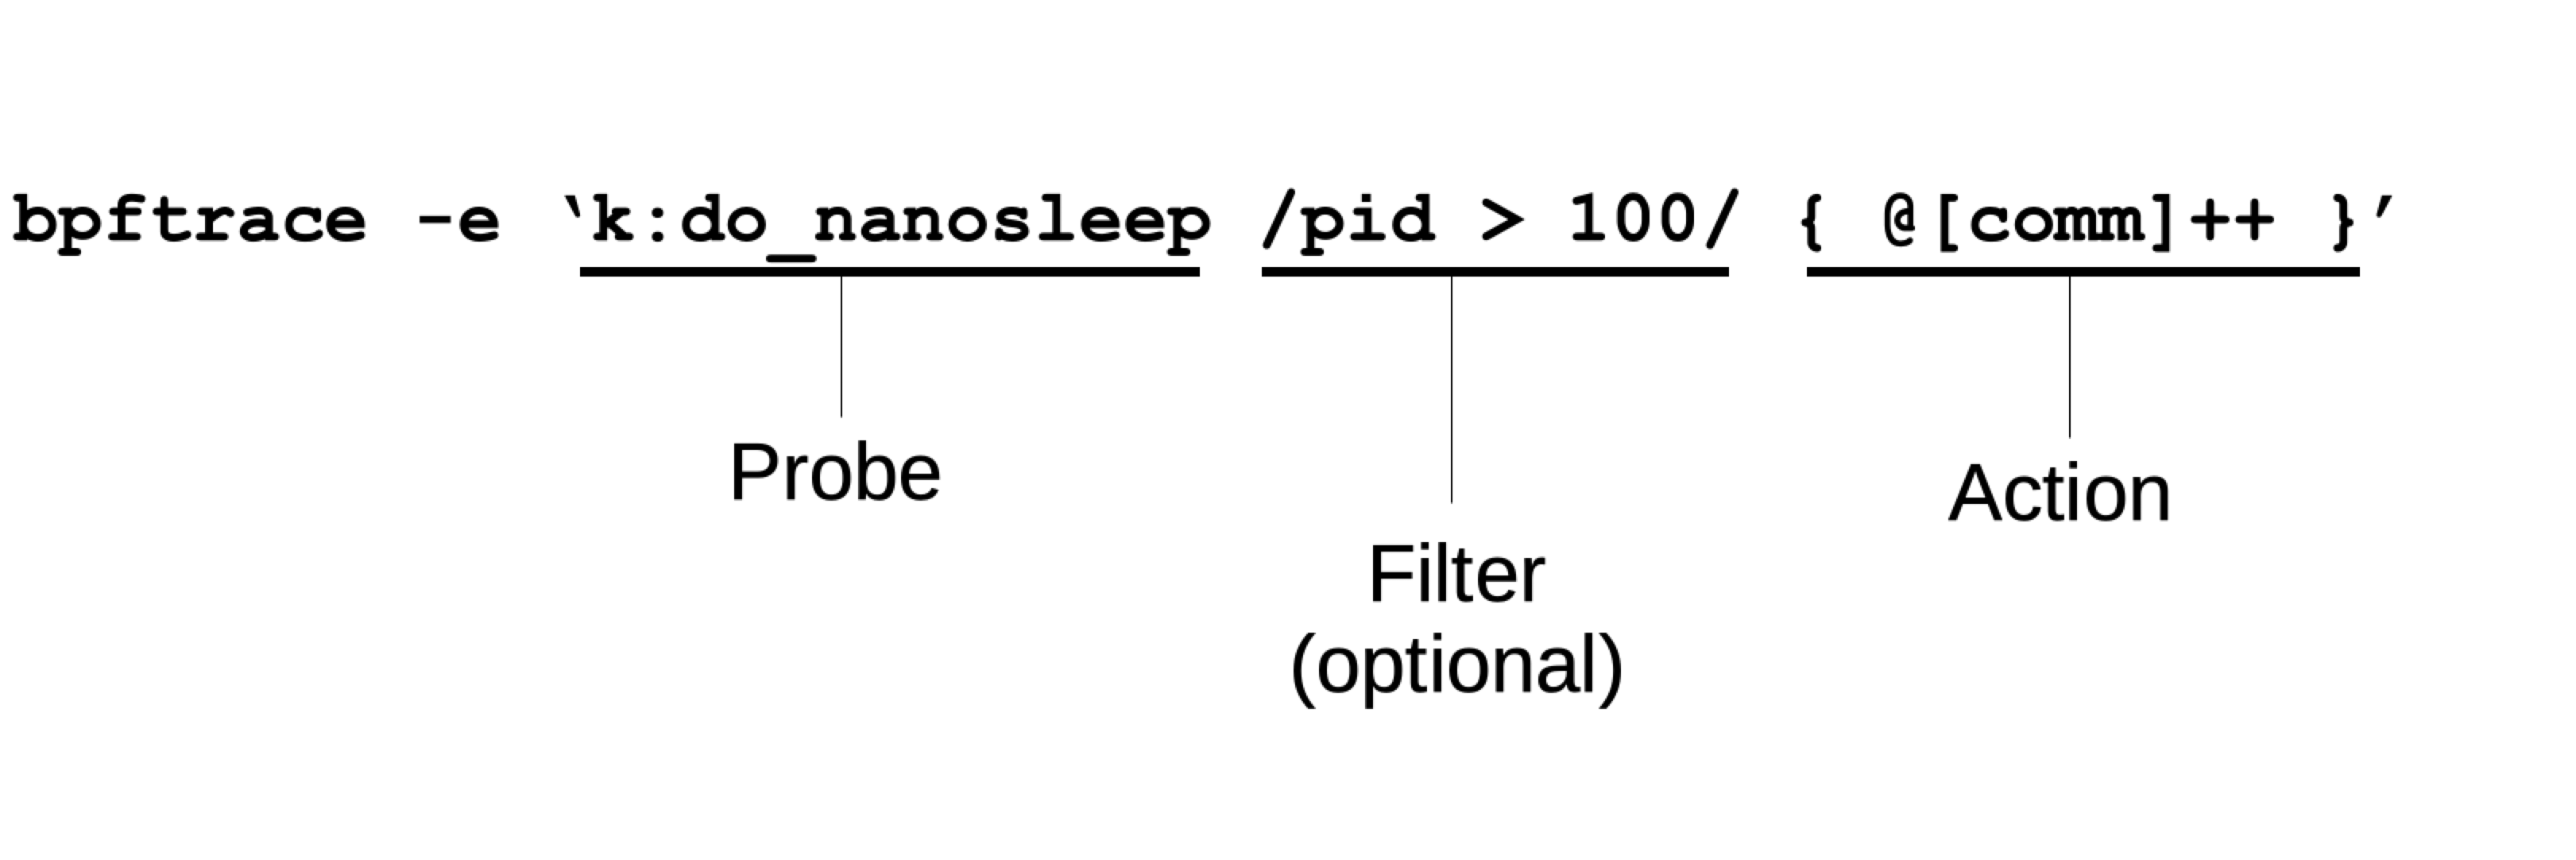
bpftrace: Probes
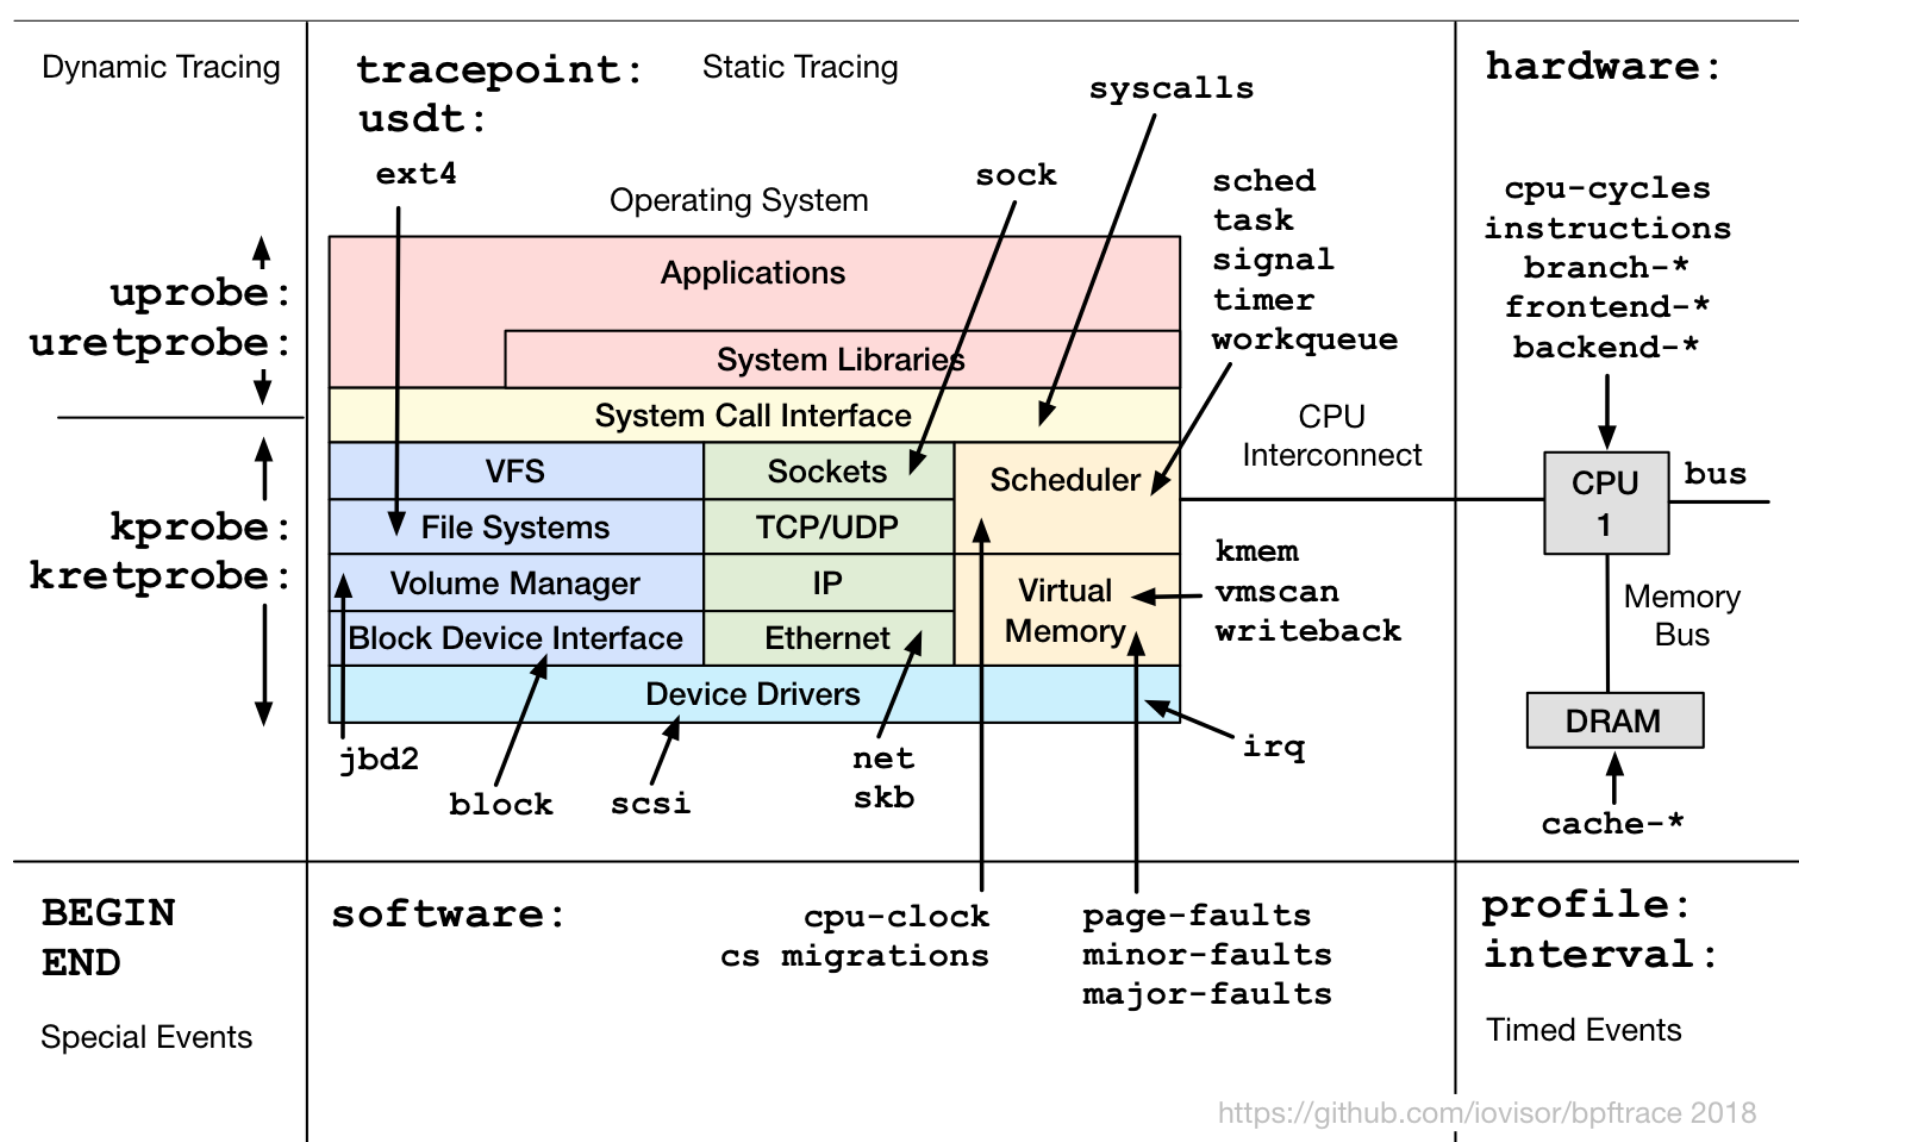
bpftrace: Probe type shortcuts
| full | shortcut | Description |
|---|---|---|
| tracepoint | t | Kernel static tracepoints |
| usdt | U | User-level statically defined tracing |
| kprobe | k | Kernel function tracing |
| kretprobe | kr | Kernel function returns |
| uprobe | u | User-level function tracing |
| uretprobe | ur | User-level function returns |
| profile | p | Timed sampling across all CPUs |
| interval | i | Interval output |
| software | s | Kernel software events |
| hardware | h | Processor hardware events |
bpftrace: Filters
- /pid == 181/
- /comm != “sshd”/
- /@ts[tid]/
bpftrace: Actions
Per-event output
- printf()
- system()
- join()
- time()
Map Summaries
- @ = count() or @++
- @ = hist()
bpftrace: Functions
| function | description |
|---|---|
| hist(int n) | Produce a log2 histogram of values of n |
| lhist(int n# int min# int max# int step) | Produce a linear histogram of values of n |
| count() | Count the number of times this function is called |
| sum(int n) | Sum this value |
| min(int n) | Record the minimum value seen |
| max(int n) | Record the maximum value seen |
| avg(int n) | Average this value |
| stats(int n) | Return the count# average# and total for this value |
| delete(@x) | Delete the map element passed in as an argument |
| str(char *s [# int length]) | Returns the string pointed to by s |
| printf(char *fmt# …) | Print formatted to stdout |
bpftrace: Functions (cont’d)
| function | description |
|---|---|
| print(@x[# int top [# int div]]) | Print a map# with optional top entry count and divisor |
| clear(@x) | Delete all key/values from a map |
| sym(void *p) | Resolve kernel address |
| usym(void *p) | Resolve user space address |
| ntop([int af# ]int | char[4 |
| kaddr(char *name) | Resolve kernel symbol name |
| uaddr(char *name) | Resolve user space symbol name |
| reg(char *name) | Returns the value stored in the named register |
| join(char *arr[] [# char *delim]) | Prints the string array |
| time(char *fmt) | Print the current time |
| cat(char *filename) | Print file content |
| system(char *fmt) | Execute shell command |
| exit() | Quit bpftrace |
bpftrace: Variable types
Basic Variables
- @global
- @thread_local[tid]
- $scratch
Associative Arrays
- @array[key] = value
Buitins
- pid
- …
bpftrace: Builtin Variables
| variable | description |
|---|---|
| tid | Thread ID (kernel pid) |
| cgroup | Cgroup ID of the current process |
| uid | User ID |
| gid | Group ID |
| nsecs | Nanosecond timestamp |
| elapsed | Nanosecond timestamp since bpftrace initialization |
| cpu | Processor ID |
| comm | Process name |
bpftrace: Builtin Variables (cont’d)
| variable | description |
|---|---|
| pid | Process ID (kernel tgid) |
| stack | Kernel stack trace |
| ustack | User stack trace |
| arg0, arg1, … etc. | Arguments to the function being traced |
| retval | Return value from function being traced |
| func | Name of the function currently being traced |
| probe | Full name of the probe |
| curtask | Current task_struct as a u64 |
| rand | Random number of type u32 |
| $1, $2, … etc. | Positional parameters to the bpftrace program |
bpftrace hands on: Tools!
- We will clone the bpftrace repository in our Linux machine;
- We are not cloning it to install bpftrace itself, but to get all the tools under the
toolsfolder
- Clone the bpftrace repo
git clone https://github.com/iovisor/bpftrace.git cd bpftrace/toolsbpftrace hands on: Trace or count TCP retransmits
- In the bpftrace tools folder, there’s a tool called
tcpretrans.bt; - TCP wants to make sure that your packet is received with the guarantee that all the received bytes will be identical and in the same order as those sent, this technique is called positive acknowledgement with re-transmission;
- What happens when there are many retransmits is that your system can have a significant overhead, then you want to know when a retransmit occurs,
tcpretrans.btdoes just that - Retransmits are usually a sign of poor network health, and this tool is useful for their investigation. Unlike using tcpdump, this tool has very low overhead, as it only traces the retransmit function. It also prints additional kernel details: the state of the TCP session at the time of the retransmit.
bpftrace hands on: Trace or count TCP retransmits (cont’d)
- In the
bpftrace/toolsfolder; - With root permissions;
- Execute the
tcpretrans.bttool;
bpftrace tcpretrans.bt- Once it’s started, the best way to trigger some retransmits is to try to connect to a closed port;
- Try it on a new terminal while leaving
tcpretrans.btactive!
telnet bpf.sh 9090bpftrace hands on: tracing read bytes using a kretprobe
- We will use the capability of bpftrace to instrument the
vfs_readfunction in the kernel using akretprobe; - We will create an array called
bytesthat will dump a linear histogram where the arguments are: value, min, max, step. The first argument (retval) of vfs_read() is the return value: the number of bytes read;
- Execute this one liner using bpftrace, then let it run for a while then use
Ctrl-Cto dump the results
bpftrace -e 'kretprobe:vfs_read { @bytes = lhist(retval, 0, 2000, 200); }'In Linux, all files are accessed through the Virtual Filesystem Switch, or VFS, a layer of code which implements generic filesystem actions and vectors requests to the correct specific code to handle the request.
bpftrace hands on: tracing read bytes using a tracepoint
- We want to do the same thing we did with the
kretprobein the previous exercise
- Execute this one liner using bpftrace
bpftrace -e 'tracepoint:syscalls:sys_exit_read { @bytes = lhist(args->ret, 0, 2000, 200); }'- Let it run for a while then use
Ctrl-Cto dump the results
What’s the difference?
While being very powerful (it can trace any kernel function), kretprobe approach can’t be considered “stable”, because internal
kernel functions can change between kernels. On the other hand using a tracepoint is a much more stable approach because tracepoints
are considered as a user facing feature and not an internal one by kernel developers.
Whenever possible use tracepoints instead of kprobe/kretprobe.
bpftrace hands on: reading userspace returns
We have a Go program that prints a random number every second.
package mainimport( "time" "fmt" "math/rand")func main() { for { time.Sleep(time.Second * 1) fmt.Printf("%d\n", giveMeNumber()) }}func giveMeNumber() int { return rand.Intn(100) + rand.Intn(900)}We want to get the random number out of it using a bpftrace program.
bpftrace hands on: reading userspace returns
- Create a file named
main.gowith the code from previous slide; - Then, compile it with:
go build -o randomnumbers main.go- This will create a binary named
randomnumbersin the current folder; - Once that is done, we just start the program
./randomnumbers; - Now, in a new terminal, we instrument the program using bpftrace and a
uretprobe:
bpftrace -e \ 'uretprobe:./randomnumbers:"main.giveMeNumber" { printf("%d\n", retval) }'Bonus point! Try to do an objdump -t randomnumbers | grep -i giveMe, what do you notice?
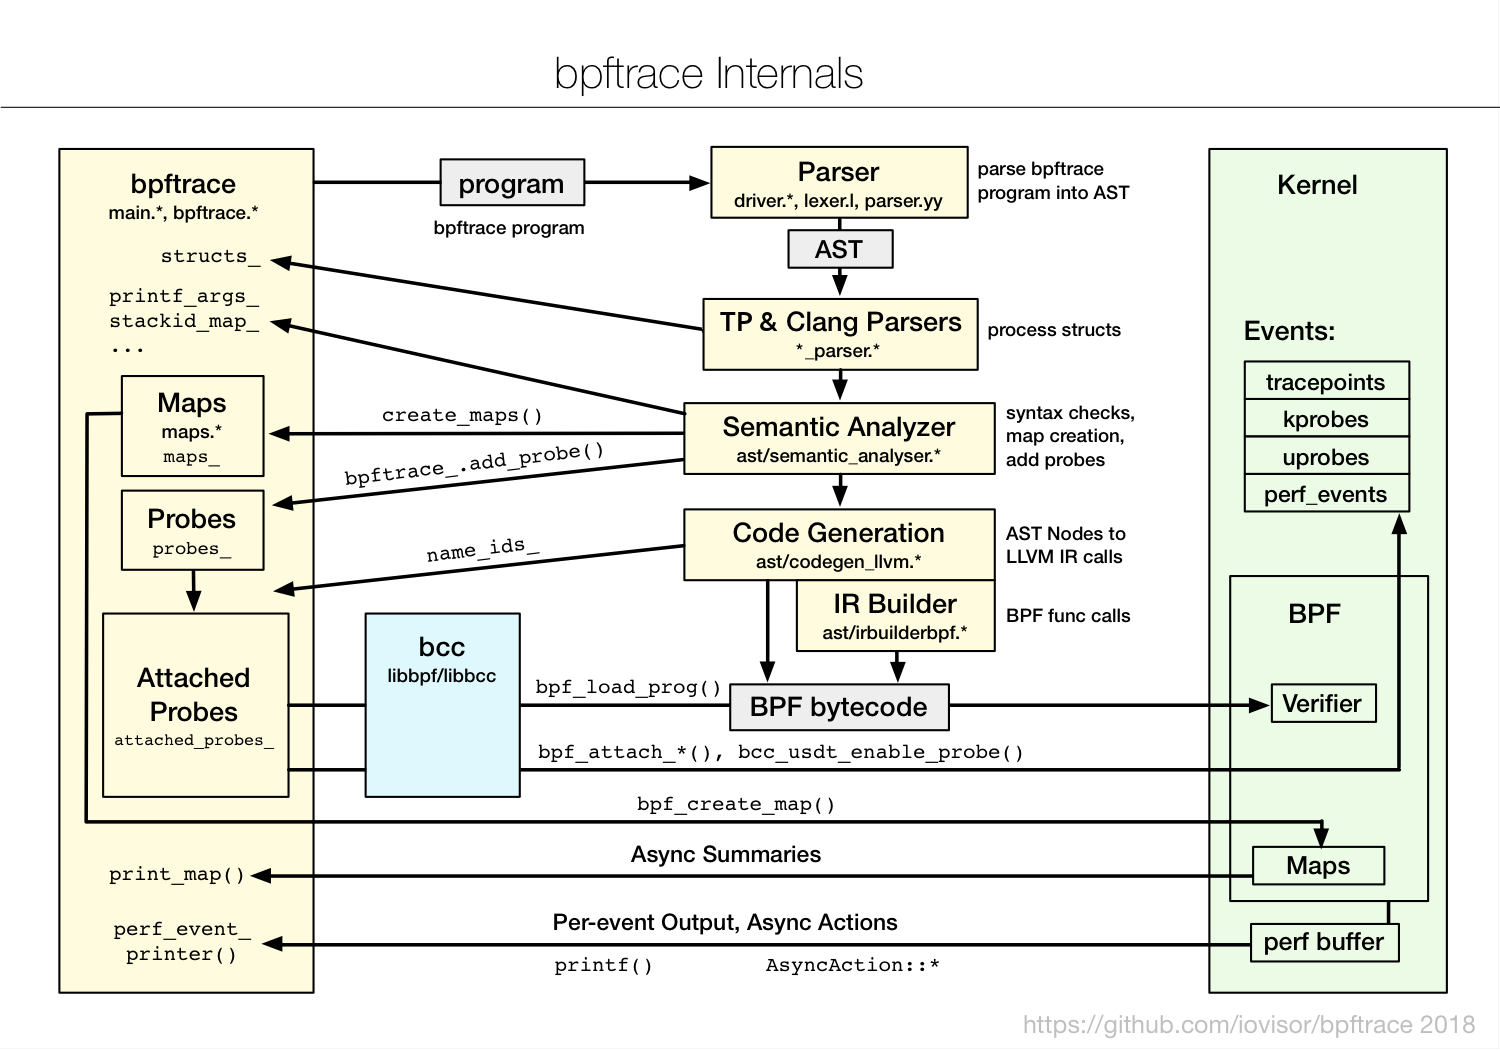
bpftrace: Internals
Takeaways
- There’s an higher level language to use eBPF, called
bpftrace; bpftracecan be used only for eBPF based tracing;- It’s pretty magic;
- There are a LOT of premade tools you can use in the
bpftrace/toolsfolder, saves a lot of time;
Approach #1: Just use a container
- A sidecar container sharing the process namespace;
- You just provide an image with eBPF loader as entrypoint;
- The loader will just load the program and execute it;
- Not extremely generic but does the job!
- A very flexible approach!
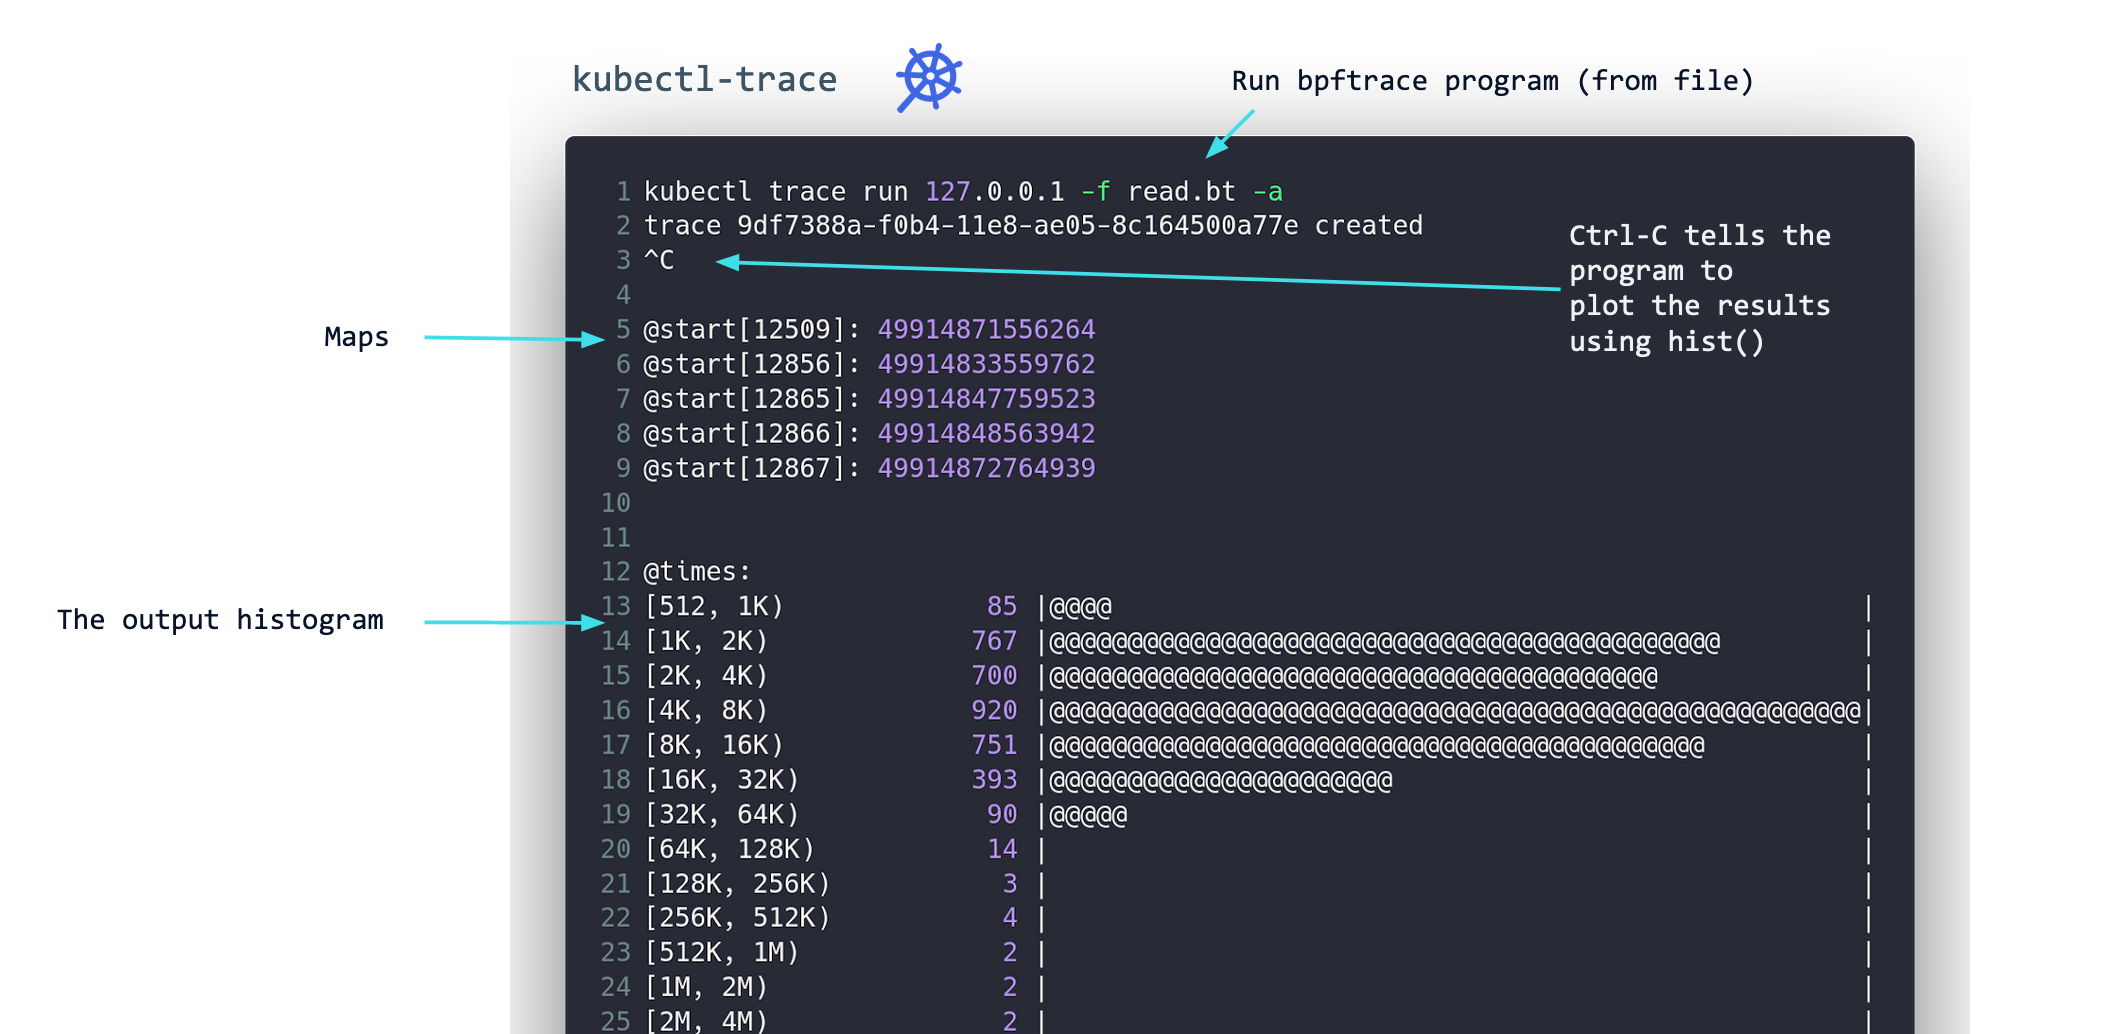
apiVersion: v1kind: Podmetadata: name: happy-borgspec: shareProcessNamespace: true containers: - name: execsnoop image: calavera/execsnoop securityContext: - privileged: true volumeMounts: - name: sys # mount the debug filesystem mountPath: /sys readOnly: true - name: headers # mount the kernel headers required by bcc mountPath: /usr/src readOnly: true - name: modules # mount the kernel modules required by bcc mountPath: /lib/modules readOnly: true - name: container doing random work ...Approach #2: kubectl-trace
- It’s basically bpftrace, but for the kubectl!
- It’s on GitHub iovisor/kubectl-trace
eBPF and Linux Networking
Main use cases
- Retrospective analysis of network traffic captured on a live system, using the pcap format for example;
- Live packet filtering, e.g: allow only UDP traffic and discard anything else;
- Live observation of a filtered set of packets flowing into a live system;
At different levels
- cBPF packet filtering
- Raw packet filtering (
BPF_PROG_TYPE_SOCKET_FILTER) - Traffic control
- XDP
cBPF and packet filtering
- Packet filtering is done using an accumulator on which filters are applied, the classic BPF way;
- One of the most popular use cases for it is
tcpdump; - It doesn’t support the use of maps;
Tcpdump
- Probably the most known use cases for live packets observation;
- It is implemented as a frontend for
libpcap; - Allows to define high level filtering expression that are then converted to a BPF filtering expression;
- Tcpdump can dump the used BPF for user inspection;
- Can read from an existing pcap file and filter on it
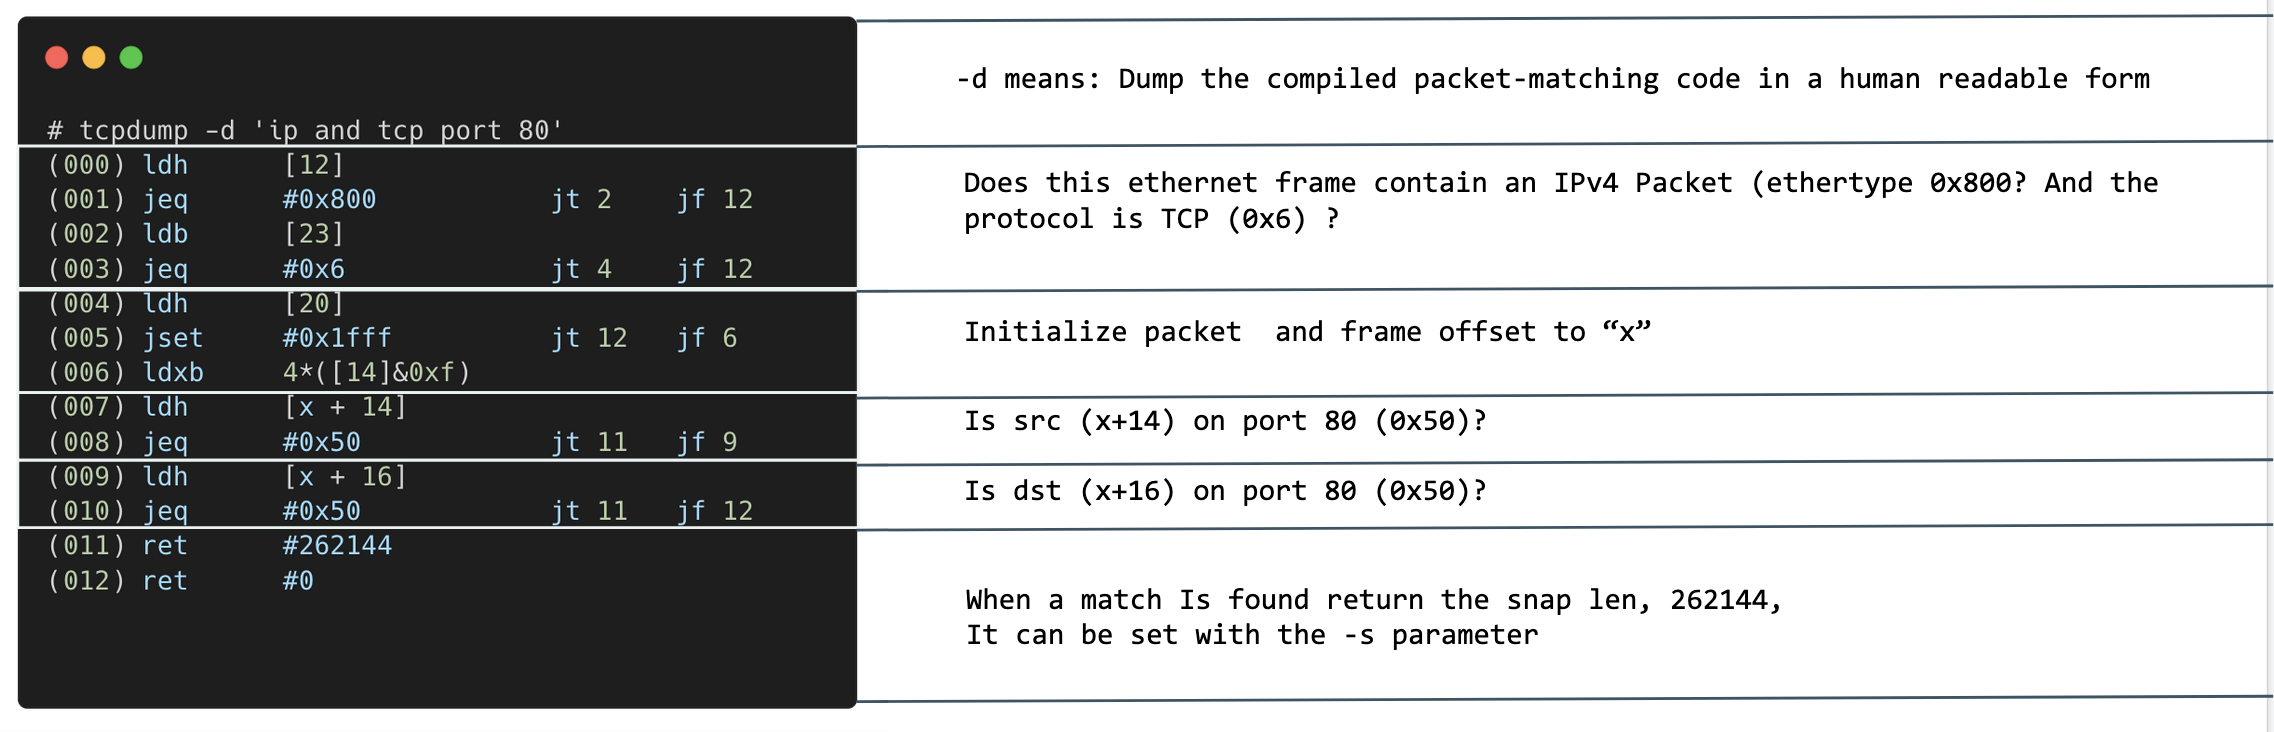
hands on: Tcpdump packet filtering
In a new terminal, execute tcpdump with a filter and use the -d option to dump the generated BPF assembly.
tcpdump -d 'ip and tcp port 8080'What do you see? Anything noteworthy?
tcpdump hands on: What is that stuff?
Raw packets filtering
- Attach a BPF program to a socket
- All the packets received by it will be to the program as an
sk_buffstruct - The program can make the decision on whether to discard or allow them based on its logic
Here’s an example, the program type is given by the SEC("socket") definition that gets translated to BPF_PROG_TYPE_SOCKET_FILTER.
SEC("socket")int socket_prog(struct __sk_buff *skb) { int proto = load_byte(skb, ETH_HLEN + offsetof(struct iphdr, protocol)); int one = 1; int *el = bpf_map_lookup_elem(&countmap, &proto); if (el) { (*el)++; } else { el = &one; } bpf_map_update_elem(&countmap, &proto, el, BPF_ANY); return 0;}Traffic Control (tc) and eBPF
- tc is the kernel packet scheduling subsystem;
- It’s made of mechanisms and queuing systems that decide how packet flows and are accepted into the system;
- It has a classifier that can use a bpf program to make the decisions, called
cls_bpf;
Among tc use cases there are:
- Prioritize certain kinds of packets
- Drop specific kind of packet
- Bandwidth distribution
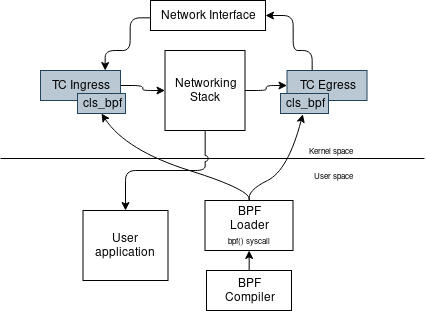
Traffic Control cls_bpf hook points
- cls_bpf can hook in ingress and egress
- that means that you can manipulate both packets your machine receives and packets it sends!
- programs receive an
sk_buff
Here’s a diagram showing the interactions:
Example: TC program to drop all TCP packets
SEC("classifier")static inline int classification(struct __sk_buff *skb) { void *data_end = (void *)(long)skb->data_end; void *data = (void *)(long)skb->data; struct ethhdr *eth = data; __u16 h_proto; __u64 nh_off = 0; nh_off = sizeof(*eth); if (data + nh_off > data_end) { return TC_ACT_OK; } h_proto = eth->h_proto; if (h_proto != bpf_htons(ETH_P_IP)) { return TC_ACT_OK; } struct iphdr *iph = data + nh_off; if (iph + 1 > data_end) { return TC_ACT_OK; } if (iph->protocol -= IPPROTO_TCP) { return TC_ACT_SHOT } return TC_ACT_OK;}The classifier program is added to the qdisc using tc:
tc filter add dev eth0 ingress bpf obj classifier.o flowid 0:Xpress Data Path
- Programs are of type
BPF_PROG_TYPE_XDP - There are three operation modes:
- Native: the network card driver supports XDP, code runs on the driver receive path;
- Offloaded: the network card hardware supports XDP, the nic CPU will execute the logic;
- Generic: It’s provided as a test mode for developers it’s for testing xdp programs without having the proper hardware;
- Once packets are processed, XDP will return one of its possible codes:
- XDP_DROP: drop the packet;
- XDP_TX: forward the packet;
- XDP_REDIRECT: similar to TX but forward to another nic or map of type CPU map;
- XDP_PASS: allow the packet
Differences between TC and XDP
- XDP programs are executed earlier in the ingress data path, before entering in the main kernel network stack;
- Program does not have access to a Socket buffer struct sk_buff like with tc;
- XDP programs instead take a different structure called xdp_buff that is an eager representation of the packet without metadata;
All this comes with advantages and disadvantages:
Being executed even before the kernel code, XDP programs can drop packets in a very efficient way. Compared to tc programs, XDP programs can only be attached to traffic in ingress to the system.
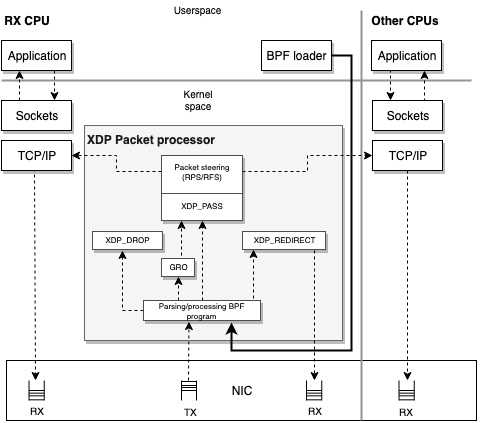
XDP packets processor
- It executes BPF programs for XDP packets
- Coordinates the interaction between them and the network stack
- It ensures that packets are read and writeable and allows to attach post processing verdicts in the form of packet processor actions
- The illustrated return codes before, are its return actions!
Example: XDP program to drop all TCP packets
SEC("mysection")int myprogram(struct xdp_md *ctx) { int ipsize = 0; void *data = (void *)(long)ctx->data; void *data_end = (void *)(long)ctx->data_end; struct ethhdr *eth = data; struct iphdr *ip; ipsize = sizeof(*eth); ip = data + ipsize; ipsize += sizeof(struct iphdr); if (data + ipsize > data_end) { return XDP_DROP; } if (ip->protocol == IPPROTO_TCP) { return XDP_DROP; } return XDP_PASS;}It can be loaded on any interface using:
ip link set dev enp0s8 xdp obj udp.o sec mysection
Seccomp
- Stands for Secure Computing;
- Implements a filtering backend based on cBPF
- You can write a BPF program hat filters the execution of any syscall by allowing/disallowing the ones you want based on your logic;
Here’s the seccomp data structure for filters as from linux/seccomp.h
struct seccomp_data { int nr; __u32 arch; __u64 instruction_pointer; __u64 args[6];}; Allows to filter based on: the system call, its arguments or a combination of them.
LSM Hooks
- The Linux security modules (LSM) framework, has a set of hooks to control the execution of (e)BPF programs,
- Allows to create a fine-grained set of privileges around them when using a module that implements BPF hooks support
- Actually implemented by Landlock and SELinux
- The only in kernel tree implementation is SELinux
- It’s based on the concept of hook calls instead of syscalls
hands on: Seccomp filters using bpf programs
- Clone the exercise repository and cd into it
git clone https://gist.github.com/fntlnz/08ae20befb91befd9a53cd91cdc6d507 seccomp-exercise cd seccomp-exercise- After following the instructions in
README.md, what do you notice?
Credits
- Thanks to all the eBPF authors and tools makers for their awesome work on it;
- Many thanks to Jérôme Petazzoni, we adapted Jérôme’s template from container.training to Hugo, we also used the terminals setup instructions and the tmux cheatsheet from that deck!
- Thanks to the remark authors for their work on it, it’s the tool we use to generate the slides;
- Thanks to the hugo authors, for the awesome static site generator;